Learn How to Use the Quick Analysis Tool in Excel
It is a set of data analysis including many options.
You can’t change options from it, you can’t see it on the ribbon.
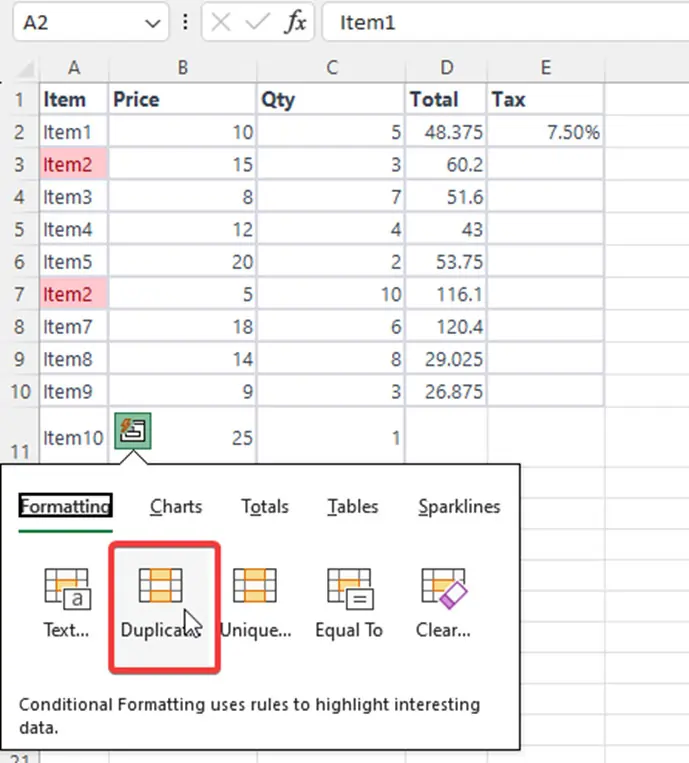
The Quick Tool is a tool that lets you analyze the data quickly. It features conditional formatting, charts, pivot tables, and sparklines. It also adjusts to what type of data (text, dates, or numbers) you have selected and shows you the options based on that.
In the conditional formatting tab, you have different choices if you pick dates or numbers. When you move over any choice from the quick analysis tool excel, you see an example of selected data.
The Location and Function of the Quick Analysis Tool in Excel Ribbon
When you open Excel and you want to find the Quick analysis tool, don’t worry. I will tell you where is the quick analysis tool in Excel. Look at a small button on the bottom right corner and press the button. It will open the Quick Analysis tool on your screen.
Can’t Find Quick Analysis in Excel
Can’t find the Quick Analysis button? No worries, it’s usually easy to fix.
First, let’s check if it’s turned on:
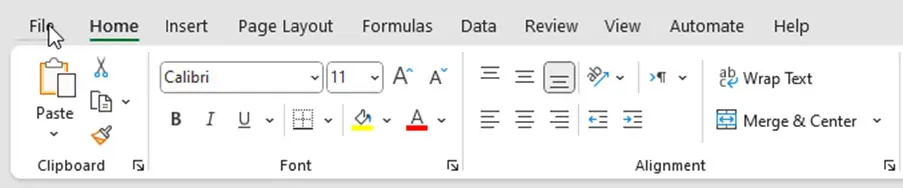
Click “File” in the top left corner.
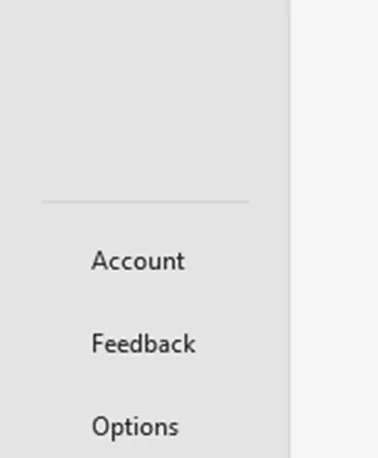
Choose “Options” from the list.
Find the “General” section and click on it.
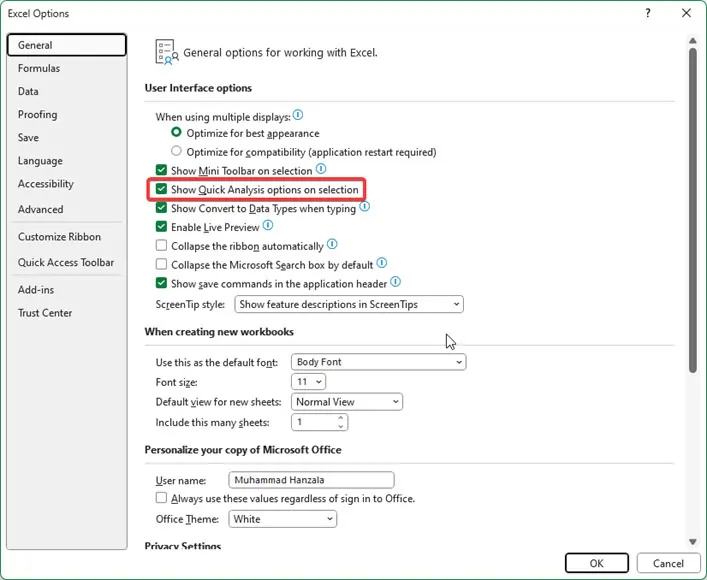
Look for a box that says “Show Quick Analysis options on selection” and make sure it’s checked.
If it’s already checked, let’s make sure you have the right version of Excel:
The Quick Analysis tool wasn’t around before Excel 2013. If you’re using an older version, you’ll need to upgrade to a newer one to find this button.
Once you’ve either checked the box or upgraded Excel, the Quick Analysis button on Excel should appear when you select data in your sheet.
Short key to open Quick Anaylsis Tool in Excel
In your keyboard, you want to open Quick Analysis Tool for your ease.
Ctrl + Q
You just need to select all of your data set and then press the short key.
Learn Excel with These Easy Keyboard Tricks
Bonus Tip! Can’t find the Quick Analysis button? No worries!
Keyboard shortcut: Press Ctrl + Q to instantly open it (even if hidden in options).
Right-click menu: Right-click your data, then choose “Quick Analysis” from the list.
Now, let’s use the Quick Analysis Tool:
Pick your data: Highlight the numbers or words you want to analyze.
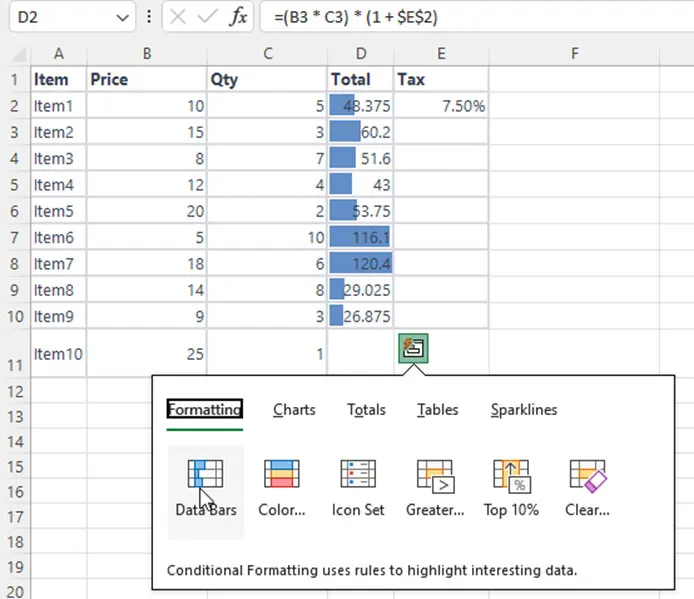
Click the shortcut: Look for the small lightning bolt button in the bottom right corner. Click it!
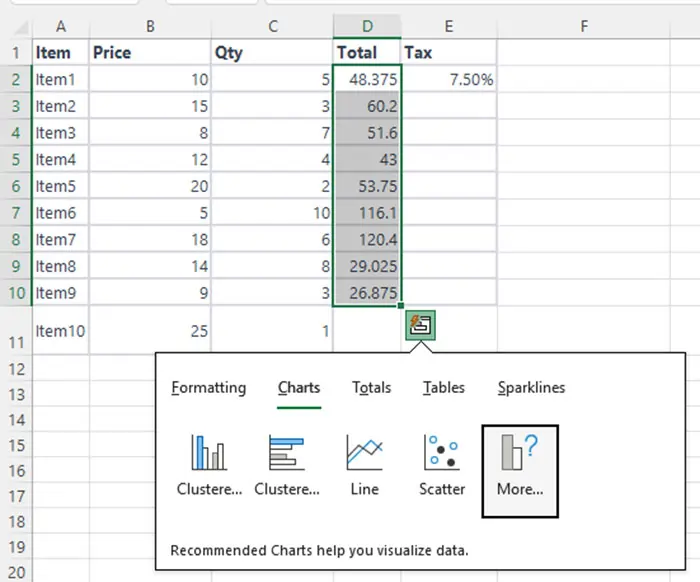
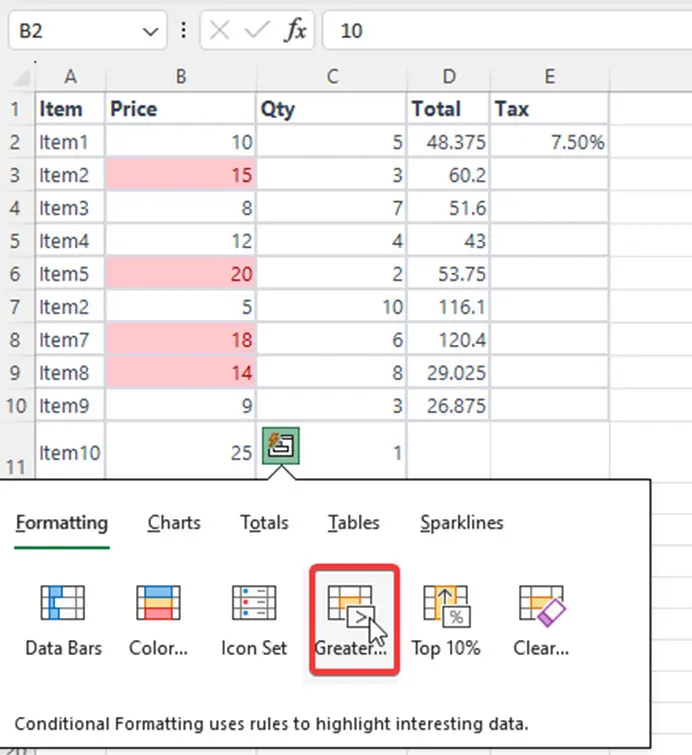
Choose your tool: Tabs will appear with different options, like charts, tables, or totals.
Pick your favorite: Click on the option you want to use, and voila! Instant insights.
How the Fast Analysis Tool helps you with Data Analysis
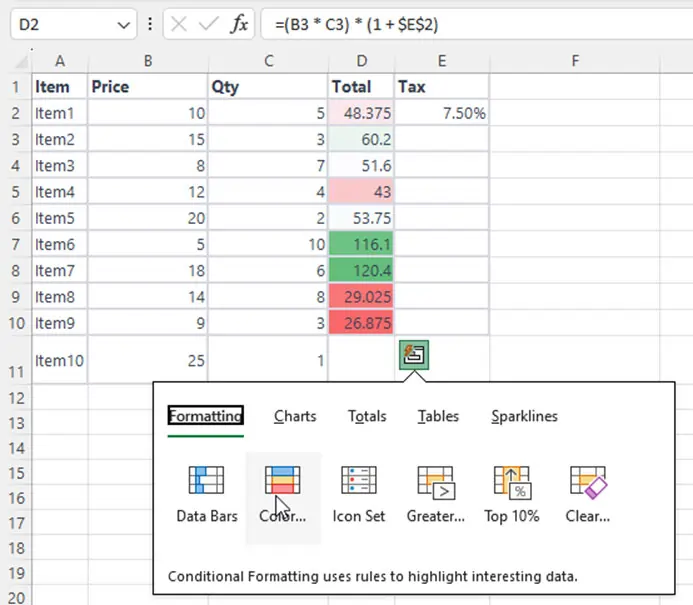
1. Create a data bar in sequence.
2. Check dates with Quick Analysis
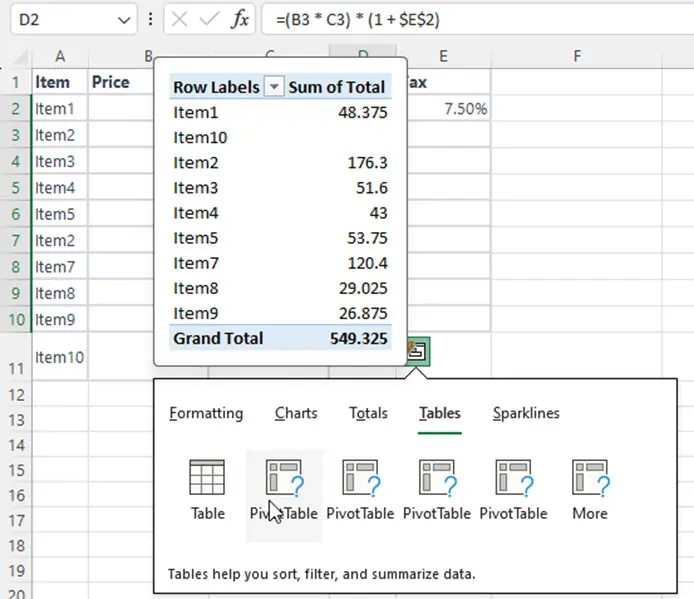
3. Build Pivot Tables with Quick Analysis
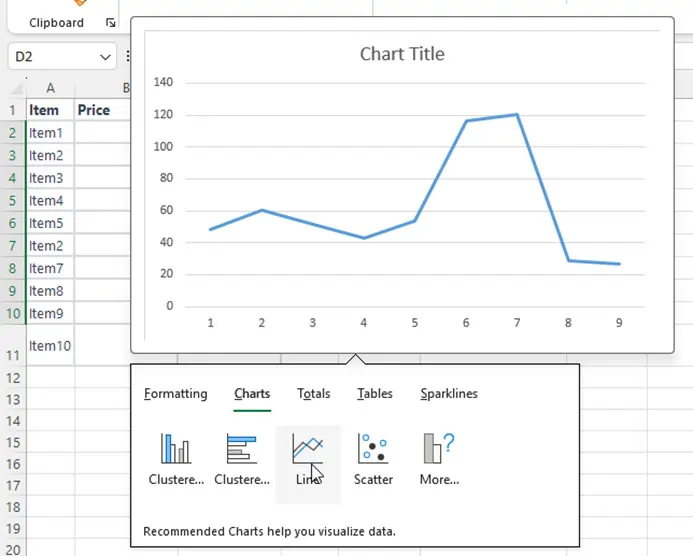
4.Generate In Cell chart with Quick Analysis
5. Find Unique and Duplicate Values with Ease